Oura ring data visualized
Posted: Fri Oct 31, 2025 11:25 am
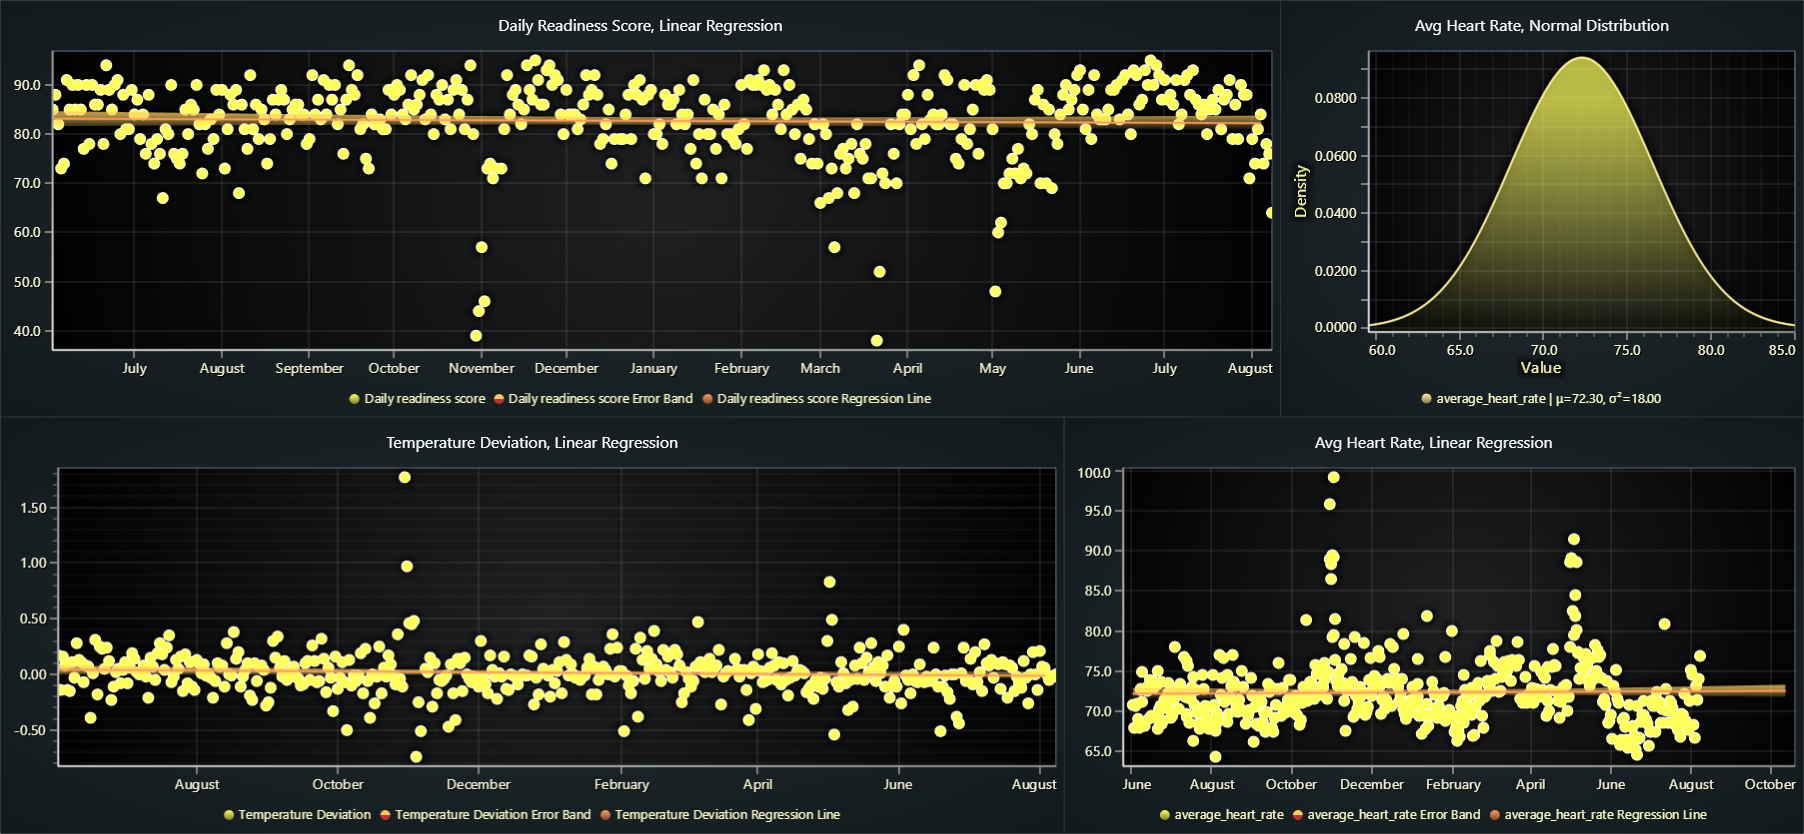
My Oura ring has been recording all sorts of data from my index finger. I took out the data and imported it to Dashtera to create many dashboards of the data. This is one of them:
 Oura data.png
Viewed 1292 times 1.6 MiB
Oura data.png
Viewed 1292 times 1.6 MiB
It shows the daily readiness score, temperature deviation and average heart rate during the same timeframe, a bit over a year.
It is super interesting to zoom in to those obvious peaks to analyze more.
It shows the daily readiness score, temperature deviation and average heart rate during the same timeframe, a bit over a year.
It is super interesting to zoom in to those obvious peaks to analyze more.